
The Patriots (that’s my team) beat the Falcons, Tom Brady is the GOAT, Bill Belichick is the GOAT.
How could this have happened?
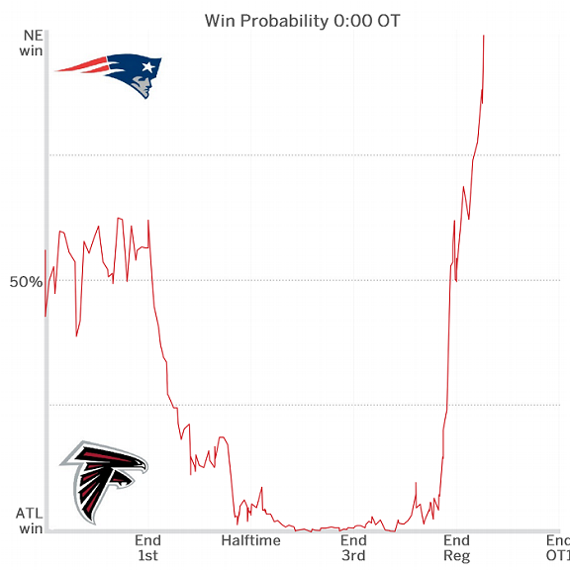
ESPN’s model had the Patriots as having 0.3% chance of winning at one point, at <1% at more than 20 points.
However, ESPN’s model and many others aren’t properly factoring in serial correlation. Or at least I doubt it, I don’t actually know the inner workings of the model, other than that they use other games in similar situations to project the results.
Serial correlation is essentially the momentum effect. The application in football is thus: it’s unusual for equally matched teams to be separated by a lot of points early in a game, but because it’s a high variance sport, that can happen whether the teams are equally matched or whether one team or the other is superior.
Once one of the teams begins a comeback, if they are actually better than their opponent, they’ll be much more likely than statistics based on other similar games would show to finish the comeback. And there’s a snowball effect, if a team comes back from down 10, they’re likely to be better than their opponent, so more likely to be able to come back from down 14.
That’s because all of the actions the Patriots had to take to come back are related to each other, they’re all team A vs team B, but a sample of similar games played by various teams is going to include more closely matched teams or outmatched teams. But once team A has come back vs team B, it’s more likely that team A is actually beating team B, and will continue to do so. The probabilities have fat tails.