Jack’s Links

      No Comments on Jack’s Links

Short links this week, not much caught my eye as particularly good. These three are the exception, and I think they are exceptionally good.

  • CuriousGnu post on the profitability of day traders: Admittedly, this post is based off of what I would call extremely anecdotal data, but is compelling nonetheless. You’ll see in the data from the graph below — about 80% of people lost money over 12 months. There are a million follow-up questions, but this confirms about what one might expect this distribution should look like. Lots of people who lost everything on presumably high leverage or highly concentrated bets, a lot of people who were burned down by transaction costs, and then a general grouping around 0% for people who had decent bankroll management, but for whom investing is essentially a zero-sum game. More than anything, this post (and the others on the website) are great encouragement to learn the basic programming needed to scrape data.

eToro 12M Gains

  • This discussion between Gene Fama and Richard Thaler is about 45 days old, but I just found it (h/t David Henderson), and is well worth the watch/read: The competing schools of thought — taking essentially opposite views of whether ‘bubbles’ exist as generally defined. Both players are involved in the crossover between economics and finance, i.e., their works are directly applicable to investing.

Fama: I’m an economist. Economics is behavioral, no doubt about it. The difference is your concern is irrational behavior; mine is just behavior.

  • Another David Henderson h/t, this video on the economics of sweatshops is a great watch. Being able to simultaneously hope for better future outcomes for developing countries and recognizing that ‘sweatshops’ are part of those better outcomes is a skill worth developing.

Sign up for links to your inbox below:
[newsletters_subscribe list=”1″]

Jack’s Links

      No Comments on Jack’s Links

Back with the best links of the week, don’t engage in public discourse without reading them, or you’ll make us all dumber.

  • Ramit Sethi on young people ‘investing’ in a home: I don’t know if I’ve written about this before, or just said it a million times, but I’m consistently amazed by how pervasive the ideas that rent is ‘throwing away money’ and that real estate is the best investment you can make have become in the thinking of people in their 20s and 30s. This is amplified by the total obliviousness to the risks inherent with what is usually an extremely levered investment.

“I don’t want to waste money paying rent.” I’m convinced this awful phrase was invented by Realtors BECAUSE IT’S SIMPLY NOT TRUE FOR EVERYONE. YOU ARE NOT WASTING RENT IF YOU LIVE IN AN EXPENSIVE AREA.

  • Alex Nowrasteh from the Cato Institute on Common Arguments against Immigration: h/t to David Henderson on this link, great breakdown of the common arguments that get thrown around and what we know about the actual economic effects of immigration (especially low-skill immigrants).

6.  “Immigrants are especially crime prone.”

This myth has been around for over a century.  It wasn’t true in 1896, 1909, 1931, 1994, and more recently.

  • Jacob Falkovich on the wage gap: Similar to immigration, the wage gap has a bunch of facts that everyone knows the headlines for, but nobody has bothered to think critically about. I recommend the whole post. If the below quote doesn’t convince you to read it, hope is lost.

Economics tells us that if a wage gap existed, smart companies would profit by hiring women, driving the sexist companies out of business.

  • Sabine Hossenfelder on being a consultant for amateur physicists (the title of the article uses the word autodidact): Fascinating both from the implications of the success of the business, but also for the insight into how (extremely invested) amateurs approach problems, take things out of context, and are generally unfamiliar with the required pre-requisites for engaging in the industry in a productive way.

My clients read way too much into pictures, measuring every angle, scrutinising every colour, counting every dash.

7. “I always give the most difficult and complicated assignment I have to the most overworked person in the company. There’s a reason they don’t have time — work is a marketplace, and it’s telling you this person is good.”

For links straight at yo face, sign up below:

[newsletters_subscribe list=”1″]


Jack’s Links

      No Comments on Jack’s Links

Fresh links are back in your eyedrums.

  • Controversial investments generally yield positive abnormal (risk-adjusted) returns using the Carhart four-factor model (beta, size, value and momentum). Screening them out produces suboptimal financial performance.
  • Scott Sumner has a post on free lunches: This is something that intelligent people shouldn’t have to be constantly reminded about, but alas, it is. Please keep in mind, everything needs to be paid for, and if you give something away for free, people will consume more of it than is efficient. See: water subsidies in California.

nearly 90% were in favor of making college free for students from lower income families

  • Speaking of terrible California policies, a blog from Alex Tabarrok on house prices and land use: the numbers really speak for themselves here, but I can never get over how the people who want affordable housing for everybody are the same people who turn around and push for zoning and regulation when it comes to building.

tokyo


Sign-up for fresh posts:

[newsletters_subscribe list=”1″]

Socially Responsible Investing – An Alternative

Larry Swedroe had a wonderful piece a couple of weeks ago on the costs of building a portfolio on a foundation of socially responsible investing.

SRI vs. Impact

I had a conversation with a colleague who is more well versed than most in the subject — it seems that socially responsible investing (SRI) is a bit out of vogue with those in the know. Probably for the reasons Larry gives in his post. The new hotness is “impact investing”, which focuses on positive screening, finding attributes in a company that you like regardless of where they operate. An example would be the oil & gas sector, where I am told the big behemoths (Exxon, Conoco, Chevron, etc.) are actually the companies pushing the hardest toward more sustainable practices, since in the long run their survival depends on it. Standard SRI makes those a big no-buy zone, whereas impact investing might not.

Investing Optimally to Give Optimally

I have a rather different take on the matter, assuming the average Joe Blow with $1 to $1 million dollars is what we’re talking about here, I’m pretty sure the GTO (that’s ‘game theory optimal’ for the non-initiated) move is to invest in whatever you expect will give you the best returns.

Then, either when you die or clearly don’t need the money, giving it to causes that relate to what you care about. Not buying 200 shares of Exxon isn’t going to change anything, especially in the secondary market, because you’re just buying Exxon from a mutual fund or day trading dentist, and none of your money is going to or coming from the company itself. Giving a few extra thousand dollars to a local charity on the other hand, now that might have a real effect.

Real Impact Investing

Now, if you have some real cash, (and I’m going to skip a big group of tweeners here) say, $5 million+, you can start to make a real difference by investing in primary offerings. In other words, a company (usually still very small) takes your money and gives you shares. These are usually not publicly traded, and are extremely risky, which is why people put together funds of these things, to diversify. However, your $50k (along with a few other peoples’) might make the difference between the company being able to make payroll for a few more weeks, keeping the lights on, and making a big discovery that changes the world in a small way.

A Dish Best Served Rich

While I can appreciate the idea of not wanting to be an ‘owner’ of a company that operates in a way you don’t agree with, I think most SRI pitches are just that, a pitch intended to sell a fund. Plus, if something you really don’t agree with is legal and makes a ton of money, is there a better way to fight the power than to funnel the profits to a cause you care about? I can’t think of one.

Retirement Savings Checkpoints

      No Comments on Retirement Savings Checkpoints

One of the most common questions that I wonder about is what sorts of savings ‘checkpoints’ people should be aiming for, especially early on in their careers.

The Inspiration

I was recently pointed in the direction of the J.P. Morgan Guide to Retirement, which I found to be a thoroughly enjoyable, if not always actionable read. It includes a slide with the same name as the title of this post.

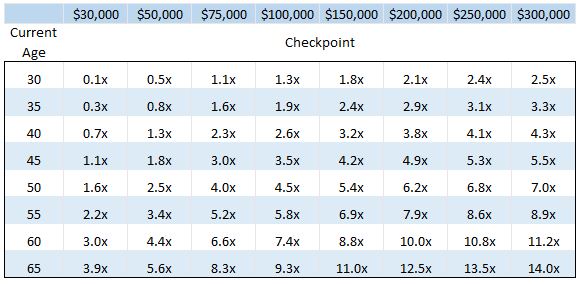
Page 15 looks like this (and do visit the entire page at the above link):

Retirement Checkpoints

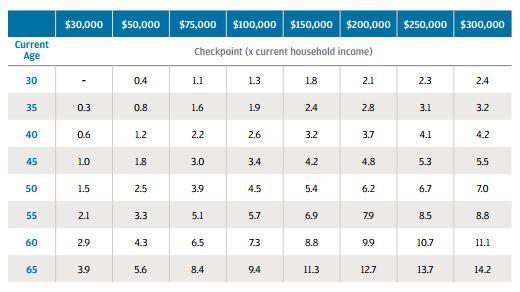
I found this to be very practicable (if it is a truly useful approximation). If a 30 year old makes $100,000, and wants to retire at age 65 that same standard of living they should have saved $130,000 by now.

The Assumptions

This obviously opens the door to questions about what the other assumptions are:

  • Retire when?
  • Portfolio returns?
  • Inflation?
  • Retirement age?
  • Years of retirement?
  • Future contributions rate?

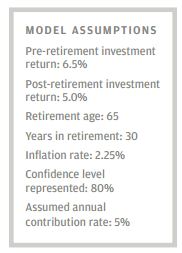
J.P. Morgan kindly provides us with some of those as well (though I have no idea what confidence level “80%” means).

Retirement Checkpoint Assumptions

They also include data on the assumed income replacement rates (if you make $200,000 and pay $100,000 in taxes, you have to replace only $100,000 (50%) of your income to live the same lifestyle in retirement (actually, $100,000 minus annual savings). If you make $30,000 and pay $3,000 in taxes, you have to find a way to replace 90% of your income. They also factor in social security (which has the opposite effect, as it replaces a much higher % of lower earners’ income).

Building My Own

Like any red-blooded nerd, I realized that if I wanted to play with the model I would need to rebuild it, make it stronger.

Pretty quickly it became apparent that even if I take the other assumptions at face value, the question of tax assumptions looms large, especially:

  • Are all contributions being made to retirement accounts?
  • Is there a static or dynamic tax assumption (at withdrawal or other)?

Another small question, are contributions inflation-adjusted? E.g., does a 5% contribution go up by 2.25% and mean a 5.1125% contribution the next year? Equivalent to 5% on an income that increased with inflation.

So, as close as I can figure (without doing anything smart like actually asking the authors [stay tuned]), basically eyeballing the data here, assuming the below is a pretty reasonable start:

  • Yes, contributions are increased to keep up with inflation, and;
  • All contributions are made to retirement accounts, and;
  • All distributions are taxed at 28%

(Click for side-by-side)

MyVersion2

New Scenarios

So now that I have my own model that works under some reasonable conditions, I can start playing with the inputs.

First, I like the flexibility, but prefer to keep returns equal pre and post-retirement. I think 6.5% is still reasonable. Then, what about retiring at 55 instead of 65? And what if my annual contribution rate is actually 15%?

New Scenario

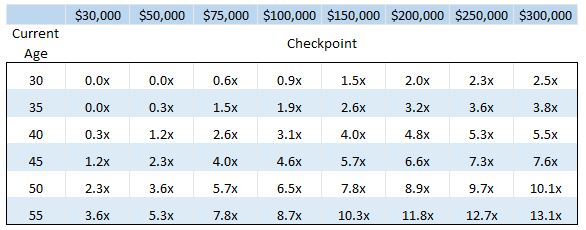
New checkpoints! Now, there is not a linear relationship here, because of the higher savings rate, the earlier checkpoints are more forgiving, while by 55, they are much higher. Since we changed multiple inputs at once, it is hard to see from the table how much of the change came from the extra 1.5% return in retirement versus the (opposite) forces of earlier retirement and a higher contribution rate.

We also run into a problem with the income replacement rate — because J.P. Morgan was assuming age 65, Medicare was in play for all of retirement, and they assumed that social security was being taken as well. For someone retiring at 55, we need to go back and add some excess draw for those ten years. We’ll save that for another post.

Age 65 Retirement Scenarios

So without backing into some assumptions for how much income to replace in the years before age 65, we can still play with other scenarios.

Here is 15% savings rate with 6.5% returns.

15and65

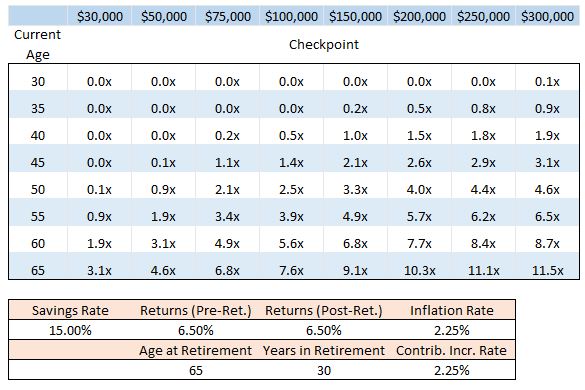
It doesn’t take much teasing of the data to find an interesting conclusion – if you are going to retire at 65 and are able to consistently save 15% throughout your working life, it’s important to get started by 35, but it is okay if you haven’t made much progress yet.

On the flip side of the coin, if you’re approaching 50 and make $200-250k (and want to maintain that lifestyle), you best be closing in on a million dollars, or planning to save even more going forward.

The Limits

This model is incredibly simple, major variables like taxable accounts are omitted entirely. I’ll probably revisit this at some point, including inquiring about the actual assumptions the folks at J.P. Morgan used, building in better ‘early retirement’ capabilities, making my own estimates for income replacement rates, etc..


Jack’s Links

      No Comments on Jack’s Links

Mostly investment/market focused this week:

  • WCI on how to retire in 10 years: He’s focused on doctors, but really any high income professional has the option open to them to retire in 10 years. The catch, as is mentioned early and often in the article, is that to retire in 10 years requires retiring at a significantly lower standard of living than the typical professional lives at (because the typical professional both works for much more than 10 years, and probably doesn’t put away enough money to sustain that standard of living either). I share his optimism that it is never too late to save for retirement, at least while you can work.

If you really want to punch out of medicine in 10 years, you can’t live like a doctor now, and you can’t do it later. What you really need is a middle class lifestyle. And I’m not talking about the middle class where one spouse is a pharmacist and the other is an engineer. I’m talking about the middle class where the household income is $50,000.

  • Morningstar on who was on the good side of bad market timing: The author, John Rekenthaler, opens with an interesting point about markets that often goes ignored, transactions are symmetrical. There is a buyer of a share for a seller of a share. Therefore, in a claim he quotes, for every bad timer, there is a good timer (whether intentional or not).

In 2009, I attended several investment conferences, some targeting institutions and others targeting advisors. The message was identical: stocks out, alternatives in.

But I also think that when the blogosphere is really on form, its interactions throw up insights of a depth and quality that the mainstream media simply cannot accommodate.

  • Scott Sumner invokes the EMH: he does it to defend the idea of an NGDP market (some of the criticisms are asinine). It appears he agrees with my usual explanation when asked about the EMH – something like: “To a first approximation the EMH is true, to a second approximation it is obviously not true.” If that doesn’t make sense to you intuitively, then it is probably worth reading the post.

In fact, we do see lots of trading. We see speculation and arbitrage, even though asset prices are usually close to a position where risk-free arbitrage is almost impossible.

With apologies to my faithful subscribers, I think the links in my emails are broken, I am trying to fix it.

[newsletters_subscribe list=”1″]


Statistical Pet Peeves

      No Comments on Statistical Pet Peeves

I am fairly well known around my office for cynicism skepticism around “fun facts”. I usually need to see the figurative receipt before I believe it. When it comes to more complicated topics, I’m going to want to see the study.

Not all studies are created equal, however, and there are a million ways to use results to mislead the target audience (often journalists or the public).

There are three kinds of lies: lies, damned lies, and statistics.

Benjamin Disraeli

There are two things I do when I spot statistic abuse: the first is to close my browser tab, shake my head briefly for having been tricked into wasting a click, and forgetting it ever happened. The second is, if the subject matter is interesting enough, to look into the original study and see what the authors actually said. If the authors themselves are the ones making things purposefully unclear, I usually just assume the study is biased too, and don’t update my bayesian priors at all.

Without further ado, two fast ways to make me think the author is a clown in the best case, or purposefully misleading in the worst case.

1.) Stating a change of a percentage as a percentage:

For example: Reporting a change in income taxes from 10% to 11% that looks like:

Income taxes are slated to rise by 10% starting in 2017.

The average reader is going to have absolutely no clue what this means, and is likely to conclude that taxes (which they probably know are already close to 10%) are going to double.

This sort of thing happens all the time, and is most often seen in headlines, which is one of my unforgivable sins. A faster way to my ‘ignore list’ does not exist. That is why my adblocker also blocks the entire news section of yahoo finance.

Now, there is a perfectly acceptable way to report the percent on a percent change, but using the same example above, it looks like:

Income taxes are slated to rise from 10% to 11% starting in 2017, a 10% increase.

It’s so easy to make things clear that I can’t help but have a harsh interpretation when it’s not done.

2.) Dual Y-axis Graphs

What is a dual Y-axis graph and why do I have beef?

Here’s the first sample I found on google.

Note the two y-axes. this is the hallmark of a two y-axis graph.

So what is the problem? The problem is that you can make a two y-axis graph “say” virtually anything you want. The relative values of units are completely out the window (and don’t get me started if the units are different). The only thing you can’t abuse is the direction of relationship from start to finish, assuming the data is a time series (meaning the x-axis represents dates/times).

If a graph has two x-axes and doesn’t have zero showing at the bottom of both axes, it’s a clear sign that the graphee has an agenda.

Now, sometimes you want to make as strong a case as possible, and sometimes you have a time series (which, in my opinion in the most proper time to use a two-axis graph, if one exists) rather than a bar chart comparing discrete variables or something, and the point of the graph is to reinforce the relationship within the series (upticks and downticks on the same days in the series, for instance), then a two-axis graph is a powerful visual tool.

For me, this means the person publishing the graph needs to have already made the point they are trying to prove clear (rather than using the graph as the smoking gun), and needs to have an already impeachable standing as far as statistical integrity. Needless to say, there aren’t many people whose graphs pass this test.

Dual axis graphs are a staple of finance presentations (investment bankers, sell-side firms, etc.) and publications with agendas, and it takes too much time to unravel the actual relationships shown in the data for them to be worth much.

Get more angry rants below:

[newsletters_subscribe list=”1″]


Retirement Doesn’t Mean It’s Time for Social Security

Retirement != Social Security Time

One of the biggest false constructs people have in their minds about social security is that they have to take it once they retire. I’m still not entirely sure if they think it is a literal requirement, or just an ironclad rule of good financial management, but it is overwhelmingly common.

Part of the problem probably lies with the most common language used around social security, “full retirement age”. Most people who turn 62 begin to educate themselves on their options, at least enough to know that every year they wait up till 70, they will increase their benefit (unless they are going to claim a spousal benefit, in which case they top out at 66 or 67 or some point in between).

For single people, especially healthy, wealthy ones (the kind that retire at 60 so they can travel Europe and hike while they have two good knees), it often makes sense financially to draw a little more from the portfolio from 62 until 70 for the enhanced benefit starting at age 70.

Why? Because the increase to social security is mostly risk free (some political risk, but the odds that two people of the same age won’t get grandfathered in because one started benefits and the other didn’t strikes me as tiny), and that increase is close to 8% (the math changes part-way through), which you would be wise to note, is much higher than that other risk-free return, treasuries.

Yield Curve

Yes, that’s 2% at the top of the graph. And yes, it does feel different to have a social security benefit that is growing at 8% per year versus having a portfolio with a balance that you can see growing at 8%, but the math is pretty much the same, and math doesn’t care how you feel about it.

The other nice thing about social security is that it is a form of insurance (in fact, your benefit at full retirement age is known as your primary insurance amount (PIA). If you do the riskiest thing in finance (well, besides invest with this guy), live a long life, the returns on delaying social security just compound and compound. If you die early (e.g., 72), yes your decision to wait sucked, but it turns out you didn’t need that money anyway!

Now, obviously there are cases where someone has saved next to nothing for retirement and can’t continue to work past 62, and they will draw social security as soon as they can, but for people who don’t fit into that bucket, just remember, you don’t have to take social security when you retire, you can file for medicare separately, and you’ll probably be better off to wait.

Couples is a more complicated issue as far as when they should begin taking benefits, although it got simpler/more complicated with the elimination of file & suspend. I haven’t taken the time to flesh out my new preferred rules of thumb (RIP to my file & suspend spreadsheet, you were so beautiful), so I won’t conjecture. But couples have the same option as single people, waiting to take benefits, even if they consider themselves “retired”.

So please, old(er) folks, don’t feel pressured by your friends or colleagues or CNBC (do they talk about social security?) to begin your social security benefits the day you walk out the door from your retirement party.


The Millennial Smokescreen, An Ode to Gen X

The greatest trick Gen X ever pulled was convincing the world they didn’t exist. At least when it comes to the changes in business.

I see what must be 10 articles a week about how this-or-that fortune 500 company is adding casual fridays, ping-pong tables, or mindfulness training to their set of perks so that they can attract the mercurial millennial.

Let me tell you, I’ve seen inside the beast, it’s all a trick. As a reminder for those of you who don’t regularly trade in generational labels, millennials are, generally speaking, 35 and under today. Gen X is 35-55. Baby boomer business owners/C-suiters are giving way to their Gen X successors, and under the guise of catering to the ever demanding and entitled millennials, the Gen Xers have begun implementing all the changes they wanted to see when they joined the workforce 20-30 years ago.

That’s right, if you thought it sounded ridiculous that millennials were demanding/creating sweeping cultural changes in their first 10 years in the workforce, consider yourself vindicated. This tea has been steeping for a long time.

For the baby boomers, don’t be too hard on yourselves, you couldn’t have seen it coming. For the millennials, keep enjoying the ride, but don’t give yourself too much credit. For Gen X – my figurative hat is off to you, convincing the old folks it was those darn kids, and improving the experience of being in an office at the same time was quite a feat.


Jack’s Links

      No Comments on Jack’s Links

Was in the Bay Area all week, not much time for reading, but still found a few good links:

  • WCI on evaluating a whole life policy: A great primer for understanding how life insurance works, has a walk-through of looking at the financial pieces (key: unbundling the bundle that is whole-life — impossible to look at the economics otherwise [just how the salesman wants it]), and gets into some relatively simple RATE and FV calculations that everybody should be able to do.

Financial Malpractice

Let’s step back for a second and think about what this insurance agent did. This agent took a 28 year old physician and sold her a whole life policy.

I have somehow managed to build a fairly successful practice and I’m not pushing hard to turn it into a billion dollar firm.

  • Ben Carlson on Good Questions and Great Questions: Hugely applicable to every area of life, not just finance. I often find myself rephrasing questions to clients before I answer because answering a good question can lead down a rabbit hole, while answering a great question is much more likely to start down a path toward peace of mind.

Good Question: How do I get rich?

Great Question: What does a rich life look like to me?

Sign up below for the hottest links every week:

[newsletters_subscribe list=”1″]